Sufficient humidity in
the workplace
The right level of humidity makes a vital contribution towards various situations in daily life – in a business environment as well as in your private home. The moisture content of the air is so important that in many countries there are clear guidelines for the operation and maintenance of humidification systems.
A narrowly defined range of 40 to 60% relative humidity has been scientifically proven to provide ideal conditions for health, performance, well-being and value retention. In modern buildings with an impermeable building shell, central heating and ventilation systems, these limits cannot be met in everyday life without active humidification. This brochure is intended to outline the medical principles for the correct air humidity as well as the positive health and economic effects that can be achieved through correct air humidification in workplaces.
Recommended air humidity range
to protect the respiratory tract
The pale blue field in the h,x diagram shows the optimum range for health protection. This range is based on the recommendations of numerous medical studies (direct link) which have investigated the relationships between the spread of germ droplets, the viability of viruses, the risk of infection and air humidity. Technical standards and specialist planners base their planning and operation of air-conditioning systems on this range.
h,x diagram according to Mollier to illustrate thermodynamic processes

Why is the air so
unpleasantly dry in winter?
Everyone knows the unpleasant effects of excessively dry air: The skin becomes flaky and cracked, and the mucous membranes of the nose and throat, as well as the eyes dry out and become irritated. This makes us feel uncomfortable and more susceptible to respiratory illnesses. But what are the reasons why room air is so unpleasantly dry, especially in the colder seasons?

A short digression into physics and thermodynamics provides answers.
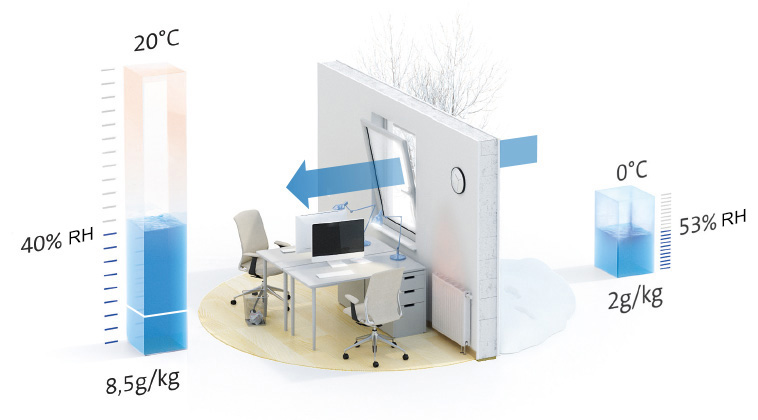
Depending on the temperature, the air has a different capacity to absorb water. In winter, the cold outdoor air has only a low capacity to absorb moisture. By heating it (which increases the capacity to absorb moisture), the relative humidity is reduced further and a very dry room climate is created. Without active humidification, a healthy room air humidity of 40 to 60% is barely feasible.

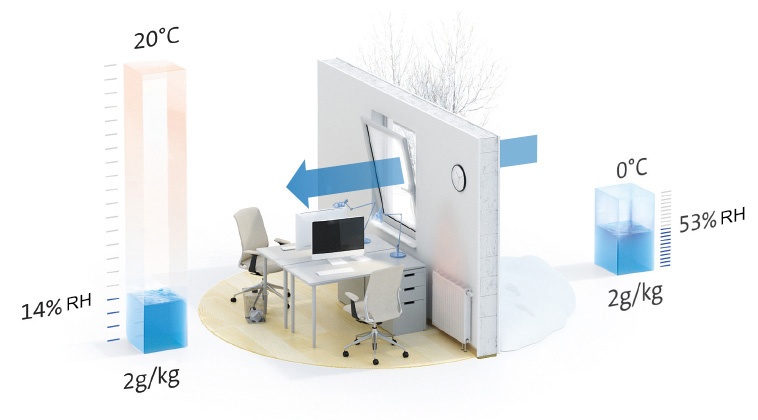
to 8.5 g of water per kilogram of air
What are the effects of dry air on
the spread of influenza viruses?
According to a new study by Yale University, low air humidity considerably promotes and increases the spread of flu viruses (influenza) and thus the risk of infection and an often severe or even fatal disease.
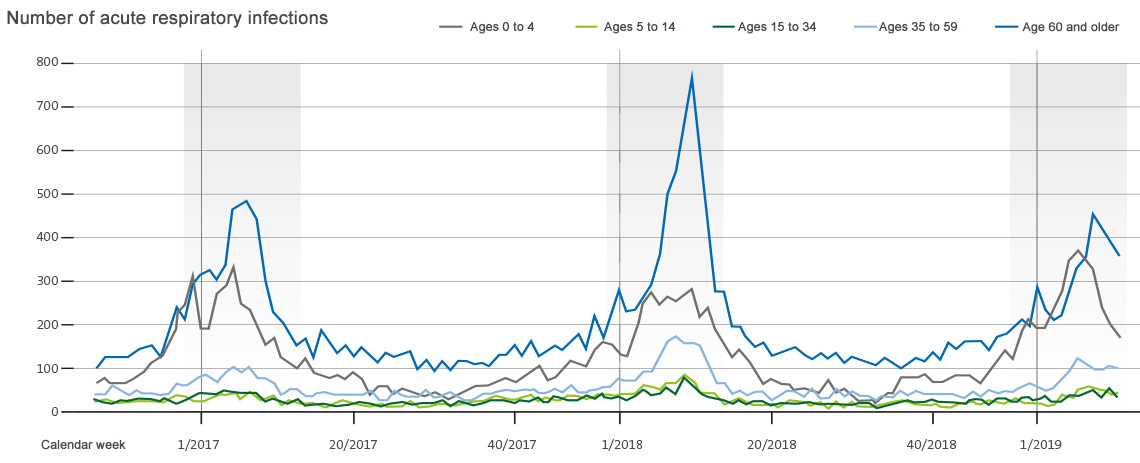
In addition, in its reports on the epidemiology of influenza, the Robert Koch Institute (RKI) records cases of illness and death caused by influenza in Germany, showing a connection to the cold (dry) winter periods. In the report for 2017/2018, the Institute came to the following conclusions (see diagram: Number of acute respiratory infections):
- The flu epidemic started towards the end of the year (calender week 50), reached its peak in February and March
(week 6 to week 12) and then slowly subsided in April. - In 2017/2018, the RKI registered around 9 million visits to doctors and 45,000 hospital admissions caused by influenza. In addition, the Institute estimates a further 5.3 million influenza-related sick days without a medical certificate from a doctor.
- The flu affects people over 35 years of age particularly severely. According to RKI, the data for 2017/2018 shows a huge increase in the number of flu cases by 2 million cases compared to the previous peak years of 2012/13 and 2014/15! The graph shown here is a statistic by the Robert Koch Institute on influenza-related sick leave in the year 2017/2018. It shows a clear peak in the cool, dry seasons between December and March (332,873 reported cases of illness were evaluated here).
Current findings of a study by the renowned Yale University
The graph shows a significant correlation between flu cases and low humidity levels from December to April.
Whether this correlation actually exists has also been a controversial topic of discussion in medicine. Proof has now been provided in May 2019 by researchers from the renowned American Yale University in their study “Low ambient humidity impairs barrier function and innate resistance against influenza infection”, which was conducted over many years. Without going too deeply into the medical details of this study on the influence of low humidity on the spread of influenza viruses and the resistance of humans to influenza viruses, key findings and results obtained by the researchers are as follows:
- There is a link between low humidity and the resilience and spread of influenza viruses, which has been clearly proven.
- Insufficient air humidity reduces the self-cleaning mechanism of the respiratory tract, resulting in a lower resistance of the immune system to viruses. When the virus breaks through the mucus layer of the respiratory organs as the first immune barrier, interferon is released to activate genes that fight and block the viruses. If the virus also succeeds in breaking through this second defense stage, the immune system is activated as a third stage, triggering virus-specific immune responses. In an environment with insufficient humidity, these three barriers become ineffective and lead to an influenza infection.
- The severity of the disease worsens at low relative humidity regardless of the viral burden.
In addition, low air humidity inhibits the ability of human cellular tissue to repair itself.
Head of Research Akiko Iwasaki summarizes the key findings of the study: Our new findings on humidity and the resulting aspects and measures to reduce flu-related illnesses are of enormous importance, as seasonal flu infections continue to increase and cause at least half a million deaths worldwide each year.
The study clearly shows that dry room air increases the effects of influenza.
It was also proven that a relative humidity between 40 and 60% minimizes a viral infection and impedes the transmission process. Therefore, we recommend the following: Low humidity is not the only factor that can lead to the spread of influenza viruses and diseases. However, ensuring a relative humidity of at least 40%, especially in the cold and dry seasons, is an appropriate measure to significantly reduce the spread of influenza viruses and the number of infections.
The functions of the 3 immune barriers to
protect us against viral infections
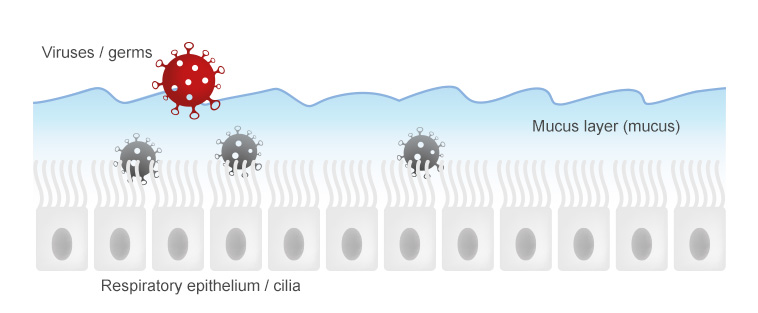

activated and triggers virus -specific immune responses using B cells and T cells.

Quick analysis of the office climate with the
indoor air humidity risk graph
If people in office workplaces complain about inadequate temperatures or humidity levels, or if frequent respiratory illnesses occur, the following procedure offers a quick and easy way to conduct an initial objective analysis and assessment of the indoor climate. The procedure is based on the so-called “Climate risk graph” (“Risikograph Klima”), which the German Social Accident Insurance (DGUV) recommends in its Guide 215-510 “Assessment of Indoor Climate” (“Beurteilung des Raumklimas”). However, since this DGUV risk graph only applies to complaints about high room temperatures and high humidity levels, Condair has developed a “Room humidity risk graph” for a dry indoor climate.
How should this risk graph be applied and what results does it provide?
Step 1:
In offices where there are complaints about a dry, uncomfortable room climate, measure the room temperatures and room air humidity levels.
Step 2:
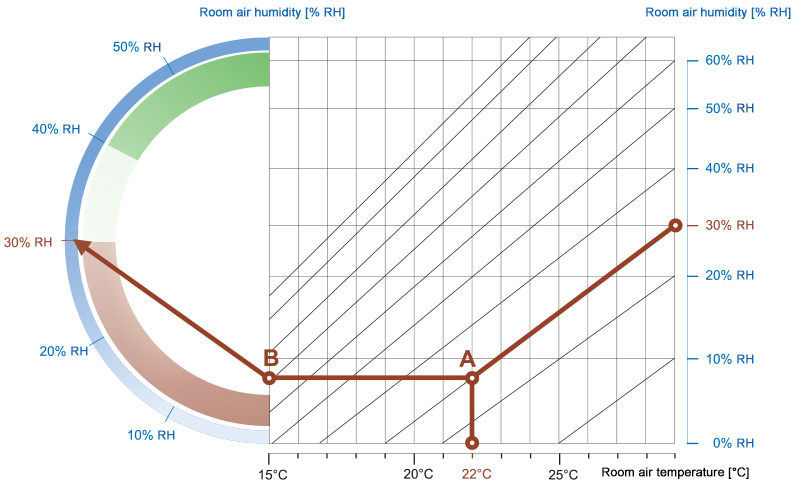
Record the measured values in the humidity risk graph: Plot the temperature on the x-axis and the relative humidity along the diagonal room air humidity lines.
Step 3:
The two examples on the right illustrate the application of the humidity risk graph.
Example 1: Action required
This applies, for example, to a room temperature of 22°C and a room humidity of 30%. The point of intersection A in the diagram results from these values. From this point, draw a horizontal line to the edge of the graph on the left (y-axis) to point B. Then connect point B with the room air humidity scale on the far left of the diagram, i.e. with the measured value of the room air humidity (30% in the example). The resulting red line runs through the red area of the risk graph.
This area signals insufficient room air humidity and, consequently, health hazards. If the result line crosses the red area of the risk graph, from a medical point of view an increase of the relative room air humidity is recommended.
In comparison, this example with the green lines in the risk graph indicates a good indoor climate with sufficient indoor air humidity. A room temperature of 22°C and a relative room air humidity of 50% were measured. This results in the point of intersection C, from which we again draw a horizontal line to the edge of the graph on the left to point D. When connecting point D with the humidity scale next to the diagram to the measured humidity value of 50%, the resulting line now crosses the green area. This area indicates a sufficient or good room air humidity and, consequently, a low risk of health hazards and low risks due to excessively dry air.
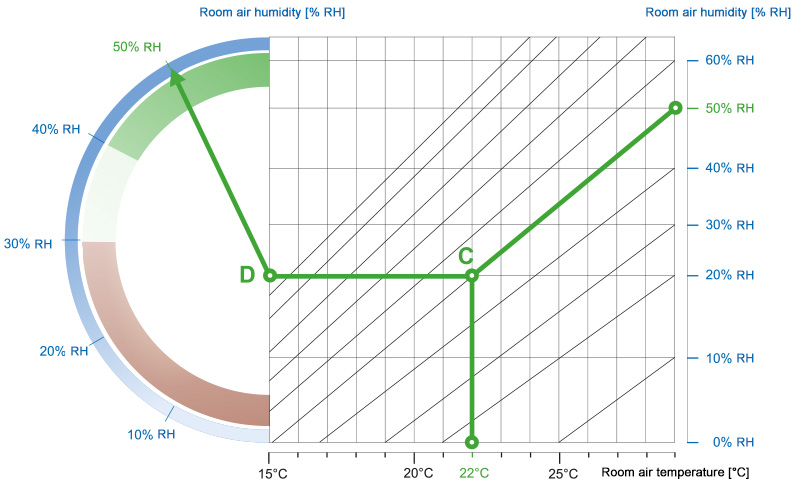
it is also advisable to increase the room air humidity.

